Monday, June 28, 2021

Shiba Inu price at inflection point

Shiba Inu price performance indicates a massive comeback. However, reversion to the mean is yet to occur and depends on the bulls’ strength to breach past a critical ceiling.

A swift move above it suggests that the uptrend will continue; however, if the buyers fail, a retracement might evolve.

Shiba Inu price at crossroads

Shiba Inu price dropped roughly 35% between June 21 and June 22 to $0.00000520, which created a new range low. Since this point, SHIB has climbed nearly 58% and came close to tagging the 50% Fibonacci retracement level at $0.00000870.

However, the dog-themed cryptocurrency is currently trading at $0.00000809, below the resistance level at $0.00000811.

Although indecisive at the moment, assuming a potential spike in buying pressure that produces a decisive 4-hour candlestick close above $0.00000811 will significantly improve the odds for the bulls to tag $0.00000870.

A successful flip of the midpoint will open the possibility of an uptick to the 62% Fibonacci retracement level at $0.00000954.

SHIB/USDT 4-hour chart, 28Jun


On the other hand, if Shiba Inu price fails to breach past the resistance level at $0.00000811, it will indicate the buyers’ inability. In such a case, SHIB might initially retrace to the immediate support barrier at $0.00000739. 

This move would provide the dog coin another chance at the 50% Fibonacci retracement level at $0.00000870. However, a breakdown of $0.00000739 will invalidate the upswing possibility and indicate the start of a reversal.

In such a case, Shiba Inu price might drop 15% to the subsequent support level at $0.00000624.

Why Dogecoin price could tank another 45%

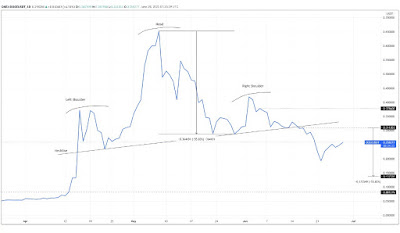
Dogecoin price has been in a downtrend since the second week of May and has failed to establish a convincing swing high. However, DOGE price action from April 15 to date shows the formation of a bearish pattern that projects a massive downside.

On-chain metrics point to failing support levels that could flip to resistance, further credence to the bearish thesis.

Dogecoin price hints at continuation of bearish setup

Dogecoin price is in a multi-month inverse head-and-shoulders pattern. This technical formation contains three distinctive peaks. The one in the middle is typically higher than the other two and forms the “head.” The slightly lower swing highs of equal height create the “shoulders.”

DOGE price sliced through the trend line connecting the swing lows of the peaks, known as the “neckline” on June 15, signaling a breakout. 

This setup’s target is obtained by measuring the distance between the head and the neckline and adding it to the breakout point at $0.311, which puts Dogecoin price at $0.137.

Although the meme coin has already crashed 38% since the breakout, the recovery has pushed Dogecoin price closer to the neckline. However, the possibility of a further downswing cannot be ignored, at least from a technical perspective. 

Therefore, a potential spike in selling pressure that pushes DOGE to produce a lower low below $0.193 will signal the continuation of the downswing toward the projected target at $0.137. This move would represent a 45% crash from its current position, $0.258.


DOGE/USDT 1-day chart, 28Jun

Transactional data hints at losing support level

The IntoTheBlock’s Global In/Out of the Money (GIOM) model adds credence to the bearishness displayed from a technical standpoint. This on-chain metric reveals that roughly 124,000 addresses that purchased 8.61 billion DOGE at an average price of $0.261 will be “Out of the Money” if the meme-themed cryptocurrency produces a decisive close below $0.242.

If this were to happen, panicking investors might sell their holdings to break even or prevent an increased loss. Such a move could cascade and exacerbate the sell-off, pushing Dogecoin price to the immediate support cluster at $0.180, where roughly 106,500 addresses hold nearly 13.56 billion DOGE.

Moreover, any short-term buying pressure might face headwinds from the underwater investors present above the current price level.


DOGE GIOM chart, 28Jun

Bull run shift snatched DOGE’s spotlight

The bull run that began in 2021 picked up in February, slowed down up to early April, but caught fire in mid-April, pushing many altcoins to new all-time highs. Despite Dogecoin having one of the best performances this bull run, its prospect as a meme coin dwindled.

Perhaps, the main reason for this is the increased meme coins or dog coins like Shiba Inu, Akita, SafeMoon and so on. The new tokens are extremely popular and were relatively less expensive than Dogecoin, which as a group siphoned many retail investors away from DOGE.

With retail shifting to newer meme coins, so did the capital, which might explain the almost zero social volume for Dogecoin. 

This metric tracks the number of mentions on Twitter, Telegram, Discord and other platforms. The higher the social volume for an asset, the more investors are talking about it and/or are investing in it. Currently, DOGE’s social volume stands at 121, in contrast to 177 for SHIB and 53 for SAFEMOON, suggesting that buyers are clustered more toward Shiba Inu than Dogecoin.

While one can speculate that this shift might have also triggered capital rotation, it cannot be portrayed with the utmost certainty.


DOGE, SHIB, SAFEMOON social volume chart, 28Jun

Therefore, if investors continue to book profit, Dogecoin price is likely to create a lower low below the recent swing low at $0.193. If this were to occur, market participants could expect DOGE to continue its descent to $0.137, the target projected by the inverse head-and-shoulders pattern.

On the other hand, if the bid orders continue to pile up, pushing Dogecoin price to produce a decisive close above the neckline at $0.311, it will invalidate the bearish scenario while signifying the bulls’ strength and indicating the willingness to move higher.

In such a case, investors can expect DOGE to climb 21% to $0.379.


Friday, June 25, 2021

50,000 electric vehicle charging stations in Europe to offer crypto payments


Over the next three years, 50,000 EV charging stations across Europe will start accepting crypto payments.


Two payments firms have partnered to roll out crypto payments across 50,000 electric vehicle (EV) charging stations in Europe.


The partnership is between Irish e-commerce and mobile payment solutions firm HIPS Payment Group Ltd and Vourity, a Swedish firm that specializes in unattended payment facilities such as EV charging stations.

The integration of crypto payments with charging stations will occur over the next three years starting from November 2021.


The firms haven’t revealed which cryptocurrencies will be supported yet, but Vourity has dropped a pretty strong hint that Ethereum is likely to be among the first after it released an image of a payment terminal with an ETH logo on it. Ethereum is moving to the much more energy efficient Proof-of Stake consensus mechanism in the next year, which could mitigate any backlash among environmentally conscious EV drivers.


We are currently evaluating what cryptos/coins we will support. It will be converted to fiat, stated Hans Nottehed, the CEO of Vourity.


Vourity payment terminal, with an ETH logo

Crypto payments will be integrated with Vourity’s EV charging stations by connecting to the blockchain via Hips Merchant Protocol’s native protocol token Merchant Token.


Back in May, HIPS Payment Group launched the HIPS Merchant Protocol, the HIPS Merchant Protocol Gateway, and its governing Merchant Token.

The protocol was built on Ethereum and Solana in May 2021 and plans to expand support to Cardano in the future.


With near real-time transaction speeds, in addition, the Hips Merchant Blockchain is designed for merchant transactions regardless if they are mobile, instore or e-commerce and utilizes the interchange concept from the payment card industry, HIPS noted in May.


EV crypto innovation

Tesla famously did a U-turn on accepting Bitcoin (BTC) payments for vehicles, with Elon Musk noting the firm won’t change course until the mining sector is at least 50% powered by clean energy. Other EV-focused firms have sought ways to innovate using  clean crypto mining and adoption.


At the beginning of this month, Canadian light EV manufacturer Daymak announced an upcoming EV set for 2023, that is fitted with a crypto mining rig that can mine Bitcoin and other cryptocurrencies while it's charging or parked.


In March, Stellantis, the parent company of European car manufacturer Fiat, partnered with Kiri Technologies, to promote an “eco-driving style,” by rewarding Fiat EV drivers in cryptocurrency via Kiri Technologies’ KiriCoin.

In that same month, Volkswagen Group Innovation, the research department of German car Volkswagen, announced a partnership with Energy Web, a non-profit organization focused on open source energy transition.


The duo teamed up to research methods of using EV’s and charging stations as part of the power grid using blockchain.


Jesse Morris, the chief commercial officer of Energy Web, spoke with Cointelegraph and emphasized the benefits of tracking the integration between EVs, charging stations, and power grids using blockchain.


Morris mentioned that during times of local grid congestion, Volkswagen drivers could be incentivized not to charge by being paid out in crypto or fiat. Additionally, utility providers could pay EV drivers to store energy during times of excess generation on the power grid.

Wednesday, June 23, 2021

Major Cryptocurrencies Including Bitcoin, Ethereum, Dogecoin, Plummet As China Widens Crackdown

$BTC Major Cryptocurrencies Including Bitcoin, Ethereum, Dogecoin, Plummet As China Widens Crackdown


Frobe​ ​news on Monday 21Jun2021 said:

TOPLINE The value of major cryptocurrencies—including bitcoin, ethereum, cardano and dogecoin—plummeted Monday after Beijing renewed efforts to rein in the sector and severed power to bitcoin mines in Sichuan province over the weekend, one of the country’s largest producers of the digital currency.


KEY FACTS

Bitcoin fell around 9% early on Monday morning after Chinese officials targeted bitcoin mines in the key province of Sichuan, part of a wider crackdown on the process through which computers solving complex problems consume huge amounts of electricity.


China is the source of the majority of the world’s cryptocurrency trade—a 2020 study found it to account for nearly 80% of global bitcoin operations—and Sichuan is its second most intensive mining region.


Local authorities claim the latest crackdown has cut the country’s bitcoin production by more than 90%, according to state media the Global Times.


The move seems to have precipitated a sharp decline in bitcoin’s hashrate, the computational power used to mine and process bitcoin transactions.


The fall caused bitcoin to drop to its lowest value in nearly two weeks, falling below $33,000 a token for the first time in 12 days.


Other major cryptocurrencies, which often mirror bitcoin’s movements, also fell Monday morning, with ether, cardano and dogecoin all losing between 5-6%.


KEY BACKGROUND

The abundance of cheap electricity in China made it an ideal location to pursue energy intensive bitcoin mining. With a great deal of this energy coming from coal power stations—an incredibly dirty source of energy—the industry is at odds with China’s new climate goals. It is also a source of unease in the crypto community, most notably with Tesla billionaire Elon Musk, who brought about a market collapse when he announced the company would no longer use the asset until it cleaned up its footprint. Beyond the environmental impact driving the current crackdown—which has also seen mines closed in Inner Mongolia and Xinjiang—China is also keen to prevent cryptocurrencies from “infringing” upon financial order, prompting a ban on financial services facilitating crypto trade.


WHAT TO WATCH FOR

The cryptocurrency market has still not recovered from when China announced its intensifying regulatory crackdown on cryptocurrencies in mid-May (an event that coincided with Musk’s environmental worries). The market’s total value, now around $1.4 trillion, is around 56% of what it was just over a month ago.


*A mining farm, video cards and asiki mining farm. GETTY


BNB/USD daily chart, 27Jul


Tuesday, June 22, 2021

Williams Alligator

 The Alligator is an indicator developed by Bill Williams. Its purpose is to identify a trend and its direction and filter good signals from the bad ones thus avoiding the range-bound market that can lead to loses.

Construction of Alligator indicator

The indicator consists of 3 moving averages which are offset towards the future:

  • Alligator’s Jaw (the blue line) 13-period smoothed moving average which is moved 8 bars into the future.
  • Alligator’s Teeth (the red line)  8-period smoothed moving average which is moved 5 bars into the future.
  • Alligator’s Lips (the green line)  5-period smoothed moving average which is moved 3 bars into the future.

Bill Williams refers to these moving averages as “balance lines”. You can see that he also gave creative names to the indicator and its elements. His idea was to provide an example that will demonstrate the behavior of the market. This example is the alligator that alternates between the periods of sleep and hunting.

How to interpret Alligator indicator

When the Jaw, the Teeth, and the Lips are intertwined, it means the Alligator is asleep and there’s no uptrend or downtrend at the market. Bill Williams recommends staying out of the market during such periods. The longer the Alligator sleeps, the hungrier it wakes. When it wakes up from a long sleep, it opens its mouth (moving averages diverge) and gets ready to take a big bite of the market. It’s time to trade! The Alligator will chase the price far away and offer a decent profit to a trader. Having eaten enough, the Alligator goes back to sleep (moving averages converge), so it's time to take profit.


If the Alligator is not asleep, the market is either in an uptrend or a downtrend.

  • If the price is above the Alligator's mouth then it's an uptrend. The indicator lines take a bullish order (green on the top, then red, then blue).
  • If the price is below the Alligator's mouth then it's a downtrend. The Alligator’s lines take a bearish order (blue on the top, then red, then green).
  • The balance lines can provide resistance/support during the trend phase. The price can go beyond the green line for the short periods of time. The more it tries to break the green line, the weaker the trend becomes.

It’s also possible to look for the so-called “fake crosses” or the situations when the green line crosses the red line but then turns back. If such cross happened during an uptrend, you can buy once the green line returns above the red one.


Combining alligator with other tools
There may be many different combinations between Alligator and other tools of technical analysis. Here are some suggestions.

  1. Look for a reversal pattern (chart pattern or candlestick pattern). Once you have it, use the Alligator for confirmation (i.e. wait for the green line to cross other lines).
  2. Use the Alligator together with the Fractals. Wait for the moment when the Alligator is sleeping (balance lines are intertwined). Put a Buy Stop order 1 pip above the latest fractal up which is located above the alligator’s mouth.


Conclusion


The Alligator indicator has a unique formula that distinguishes it from a simple set of moving averages. Being based on moving averages, the indicator does react to the price changes with a time lag. At the same time, it can be used both for picking out the start of a new trend and a moment when a trend resumes after a correction. The Alligator is a ready-for-use trading system that can be accompanied by other analytical tools for the greater precision of trading. When you use the Alligator, check several timeframes of the chart.

Featured Posts

Two Ways to Win in Trading

Two approaches to trading Forex trading is complex and challenging. Numerous and various market participants constantly contemplate how to ...